

Racing cyclist in peloton saves more energy than previously thought
Racing cyclists who ride in the middle of a large peloton use only 5 to 10% of the energy they would otherwise need if riding solo. That figure is much lower than was previously thought, but does confirm the experience of professional cyclists that riding in a peloton is relatively relaxed.
The numbers, which were published on 29 June, are the result of Eindhoven University of Technology’s The Peloton Project, where researchers combined wind tunnel experiments with gigantic simulations.
New insights
The Tour de France is just a week away. This year, participants in the biggest cycling race of the year – go Tom Dumoulin! – will be able to benefit from some brand new scientific insights.
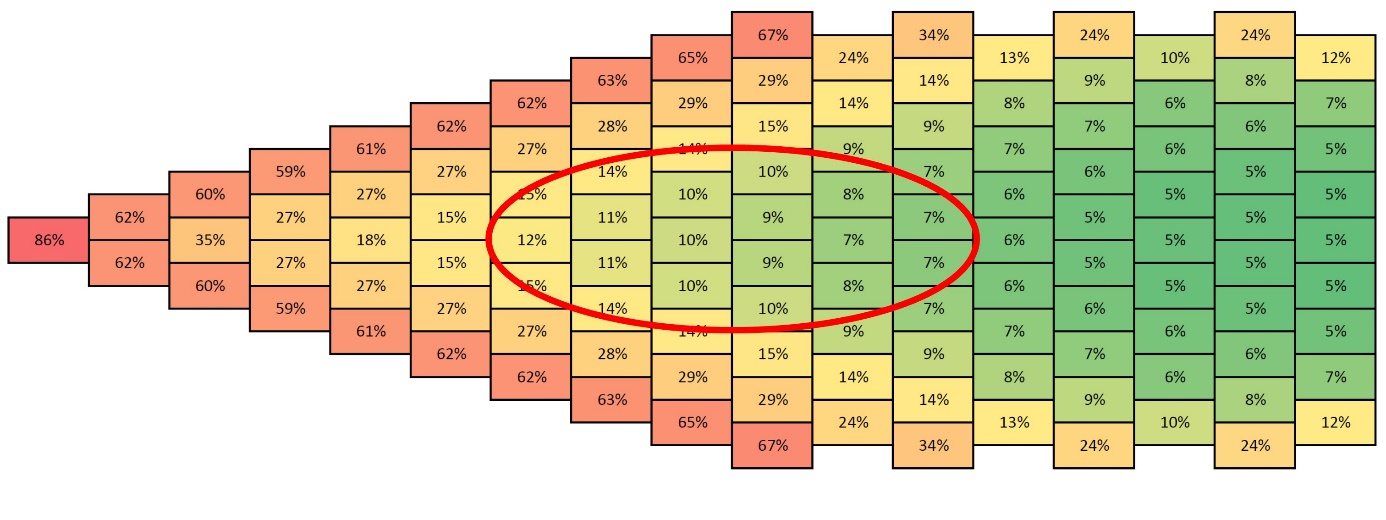
In first place, riding on the edges of the peloton isn’t the best tactic. 'This might reduce the chance of falls, but we found out that the resistance encountered there is a lot higher than inside the peloton,' says professor Bert Blocken of Eindhoven University of Technology and KU Leuven.
The best place for a rider to conserve strength is a spot in the group about one third down from the front, where the chance of falling is small but little energy is required.
Gentle bike ride
The second point learned from the research is that a rider only uses 5 to 10% of the energy in the middle of a peloton compared to riding alone. Until now, scientists estimated that the figure was between 50 and 70%, so the energy saved by a rider in the middle of the group turns out to be considerably larger than previously thought. While zooming along at 50 km/h with the peloton, a rider feels as if he or she is only driving at the lowly pace of 12.5 km/h – more in line with the speed of a recreational cyclist on a gentle leisurely ride. In the peloton, the riders at the front ‘push away’ the air, creating an area of lower air pressure.

This is the scientific confirmation of a fact well known to professional cyclists: you can save your strength by staying in the peloton, where it simply takes less energy to get the cogs whirring at the same speed. However, this effect is much stronger than was always thought. Blocken says, 'This might also explain why riders nowadays find it so difficult to break away from the pack.'
New racing tactics
The new insights may also affect the tactics used by teams to win a stage. Their battle plans study the ideal moment for their top racers to try to break free from the peloton, but now these plans may have to be changed following this research showing that riders in the pack retain more energy than was previously thought. Riders may now attempt to break free from the pack even later in the race.
Gigantic computer simulations
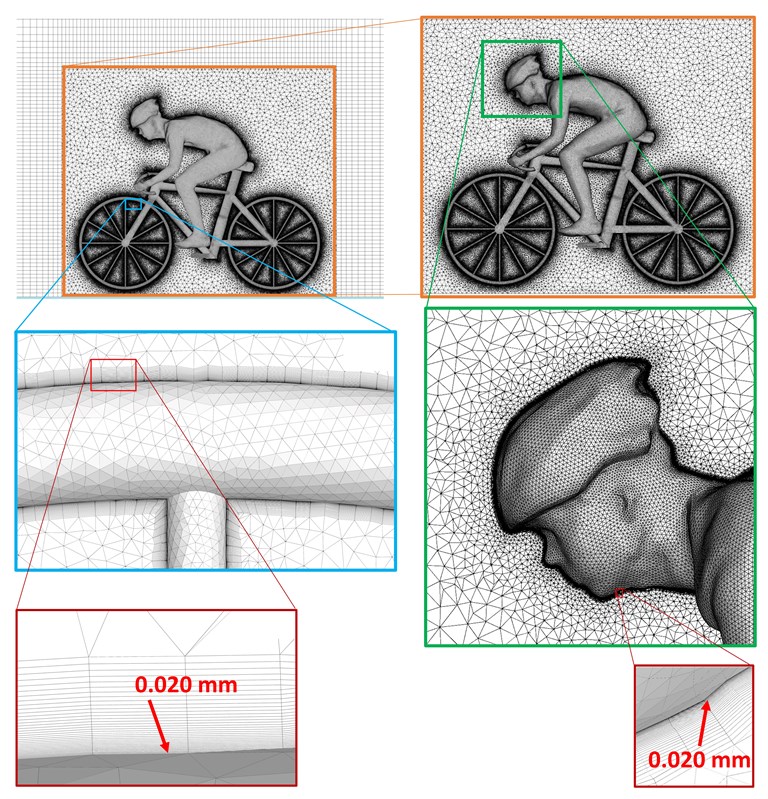
The conclusions taken from The Peloton Project are the result of gigantic computer simulations of a cycling peloton. The peloton was reconstructed in a virtual environment, after which ANSYS computational-fluid-dynamics software (CFD) applied the laws of physics concerning liquids and gases to almost three billion discrete control volumes (see figure below).
'The thin laminar sub-boundary layer against the skin of riders and on the bikes means these volumes have to be particularly small, with a thickness of 20 μm, in these areas,' explains Blocken. The air resistance is largely determined by where the boundary layer ceases to exert an effect.
13,824 processors
In order to calculate data concerning the entire gigantic peloton, project partner Cray in the US ran its computers at full power for an extended period. Even using 13,824 processors and 49 TB of RAM, the complete calculation of the group of 121 riders took more than fifty hours. According to the partners, this is the largest CFD simulation ever in the field of aerodynamics in sports.
Since a simulation cannot provide comprehensive proof, the peloton was also rebuilt in its entirety on a scale of 1:4, by Eindhoven University of Technology and KU Leuven, with models made by Custom Company, Flexform and Tenax (see the picture at the top of this report.) 'Thanks to the superhuman efforts of these companies, we succeeded in making 121 identical models which met the requirements for wind tunnel tests within our time limit.' The models were subjected to an air flow of 60 m/s in Luik and 30 m/s in Eindhoven, more than enough to confirm that the simulations were correct.
Now we just have to wait and see if the world’s top cyclists are interested in hearing what science has to say, and whether things get even more crowded at the heart of the peloton.
If you found this article interesting, subscribe for free to our weekly newsletter!
Images: Bart van Overbeeke / Eindhoven University of Technology.


Reacties